A live market scanner for NSE and MCX
A unified web terminal for Indian equities, derivatives, and commodities, built so traders can scan the market without checking symbols one by one.
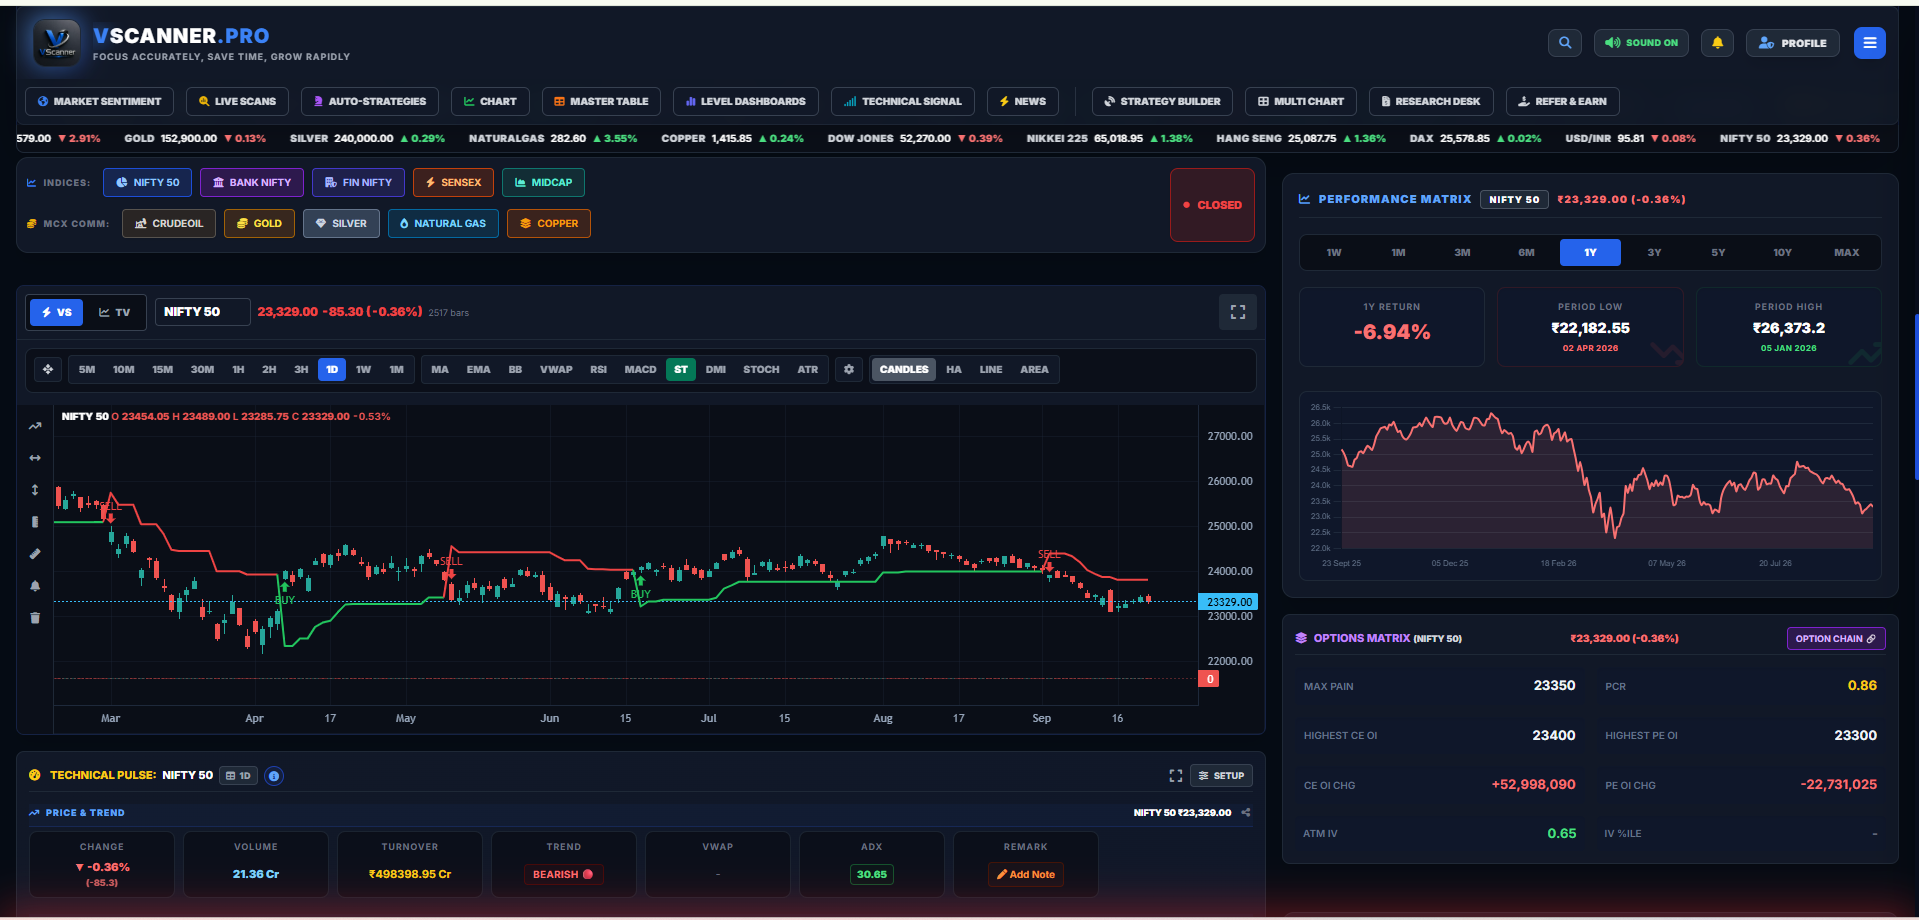
Live Terminal v3: self-hosted charting engine, SuperTrend signal markers, performance metrics, and quick index switcher in a single viewport.
The problem
A trading-education business runs practical courses for retail traders. The client wanted one place where users could scan the F&O universe, compare technical conditions and inspect market context without checking symbols one by one.
The goal was a single web terminal tailored to the specific technical indicator combinations the business taught, which active traders could keep open throughout the trading session to follow setups in real time.
What was built
- Live Terminal (v3): A consolidated workspace combining canvas charting, index quick-selectors, performance metrics, and technical signals in one view.
- Self-hosted canvas charting: Built on TradingView Lightweight Charts, displaying OHLCV candles, custom SuperTrend buy/sell markers, moving averages, and manual drawing tools.
- Master Table: A configurable data grid with preset F&O, index and MCX universes, plus custom watchlists built from nearly 2,000 searchable NSE symbols, displaying multi-timeframe indicators, relative percentage distances to key levels, and candlestick pattern detection.
- Table customization engine: Drag-and-drop column reordering, visibility toggles, and saved preset layouts (Favourites, Essentials, Technical, Options, Fundamentals).
- Technical Pulse: A single-symbol analysis view that brings together a selected symbol’s chart, multi-timeframe signals, moving averages, key levels, and options data in one configurable view.
- Market Sentiment & Global Matrix: Market-wide sentiment gauges, Indian indices, global markets, and commodity context displayed alongside live stock scans.
- Multi-Chart comparison view: A four-chart side-by-side workspace for comparing Indian indices and MCX commodities concurrently.
- Option Chain: Real-time strike ladder displaying Open Interest distribution, Put-Call Ratio (PCR), and Max Pain across strikes.
How the interface evolved to v3
Earlier versions of the dashboard separated charts, screener tables, sentiment gauges, and technical pulse cards across multiple tabs and long-scrolling pages.
In practice, navigating separate views to confirm a setup added friction. Through product iteration, the interface was consolidated into Live Terminal v3: bringing the interactive chart to the top left, placing performance metrics and options summary directly beside the candles, elevating the Master Table, and positioning live scans directly beneath the ticker. This brought market posture and symbol-level detail into a single viewport.
Master Table and user customization
The Master Table gives traders a wide technical view across preset market universes—such as F&O, major indices, and MCX commodities—as well as custom watchlists built from nearly 2,000 searchable NSE symbols. Instead of showing only static price numbers, moving average columns (SMA 7 through 365) and pivot levels calculate the relative percentage distance from the current price, letting traders spot breakout and breakdown candidates at a glance.
To keep a wide data grid usable, the table includes a layout manager for column visibility, ordering and presets. Users can toggle entire indicator categories, drag columns into their preferred sequence, and switch between saved presets.
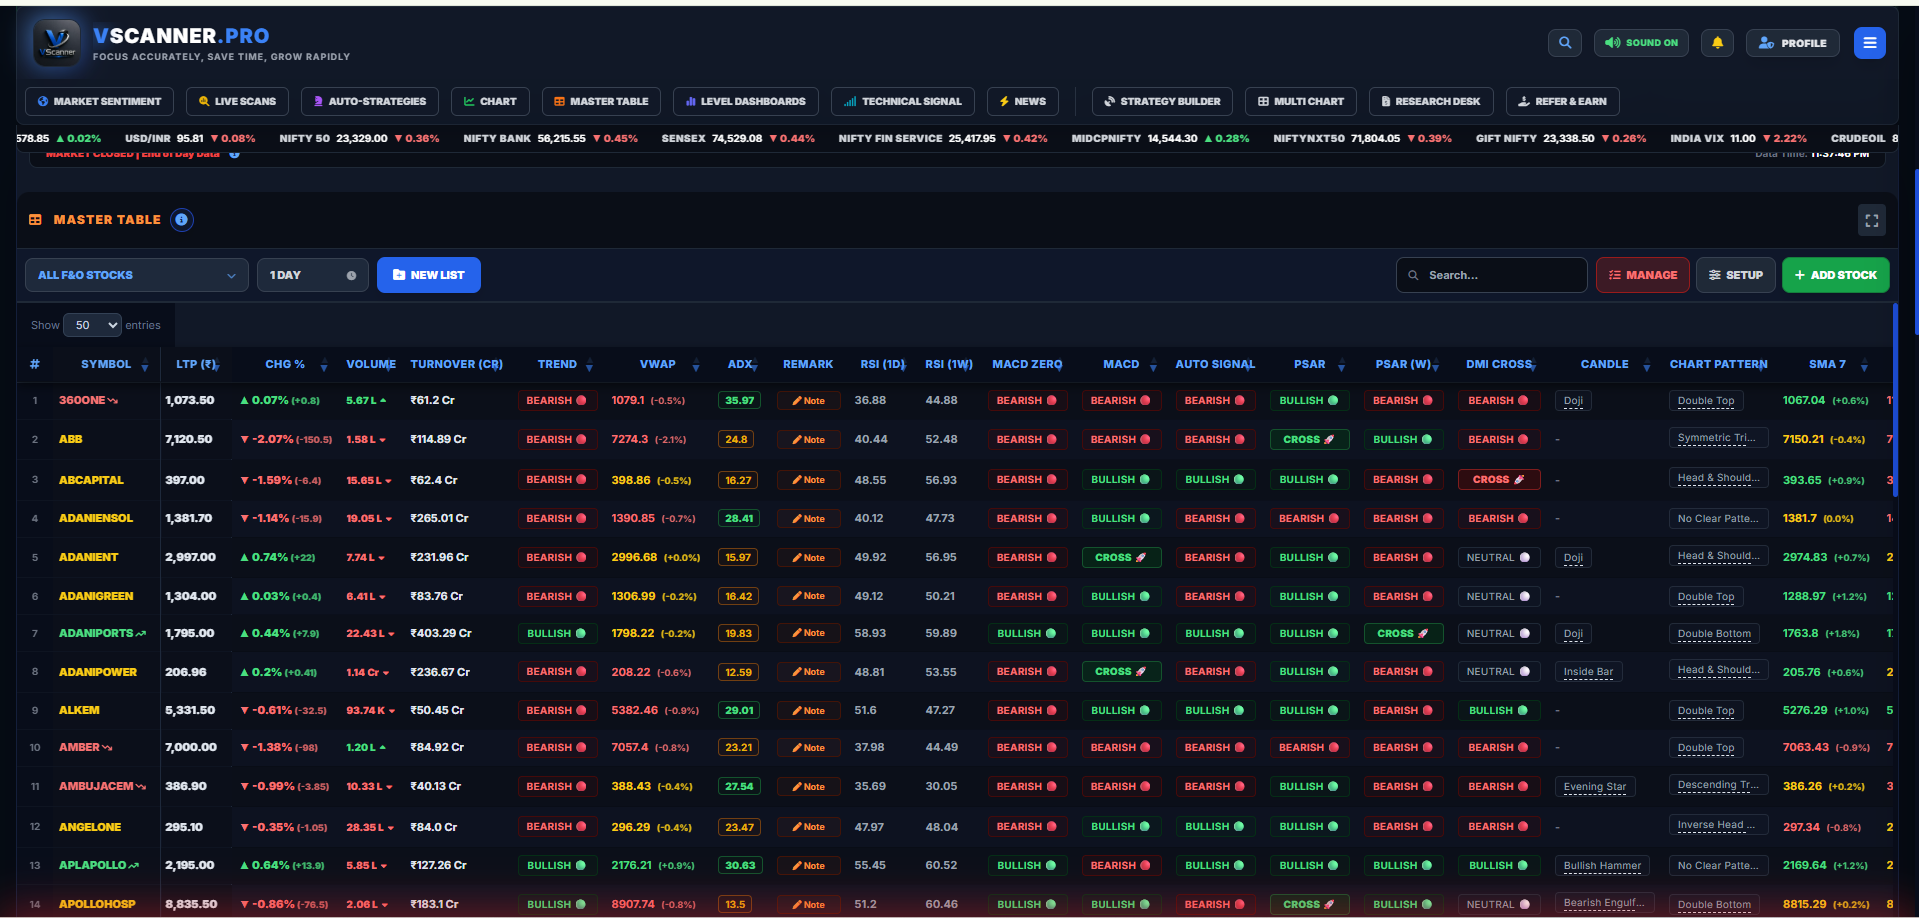
The Master Table: 80+ configurable columns across preset market universes and custom watchlists.
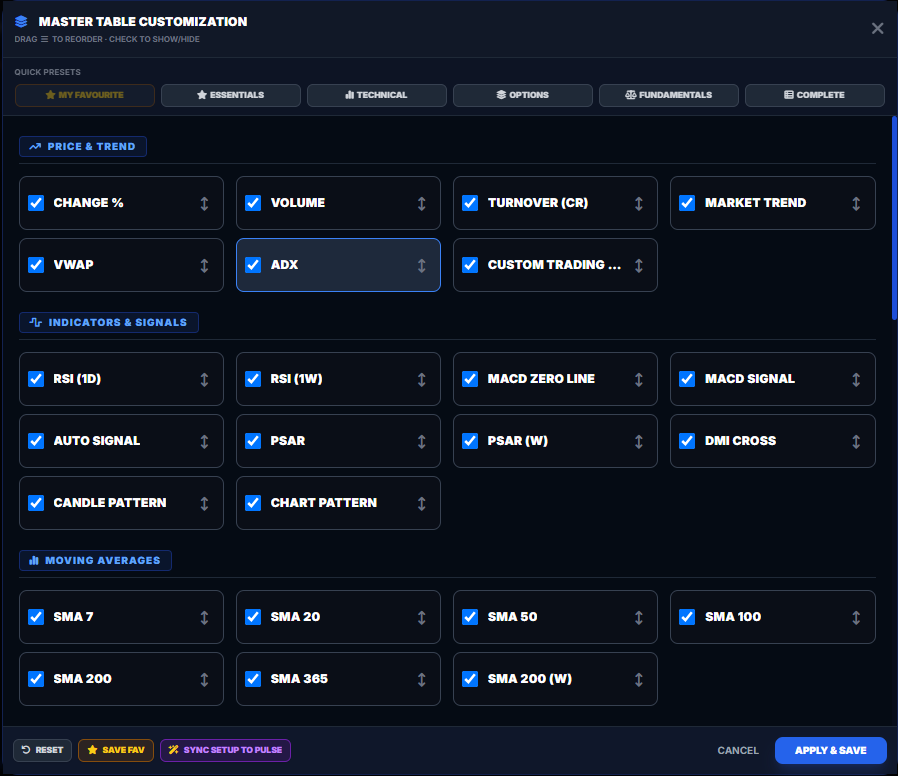
Column setup manager: users can drag to reorder columns, toggle indicator groups, and save custom presets to local storage.
From market-wide scan to single-symbol analysis:
The terminal connects broad scanning directly to detailed inspection. Clicking any symbol in the Master Table or market overview opens a dedicated Technical Pulse view. This brings together the selected symbol’s chart, technical signal matrix across timeframes, moving average distances, support and resistance levels, and options data. Like the Master Table, users can customize which Technical Pulse panels remain visible based on their trading style.
Multi-market comparison view
The Multi-Chart workspace displays four independent charts side by side, letting users compare Indian indices (such as NIFTY 50) and MCX commodities (such as Gold, Silver, and Crude Oil) concurrently with independent timeframe controls on each pane.
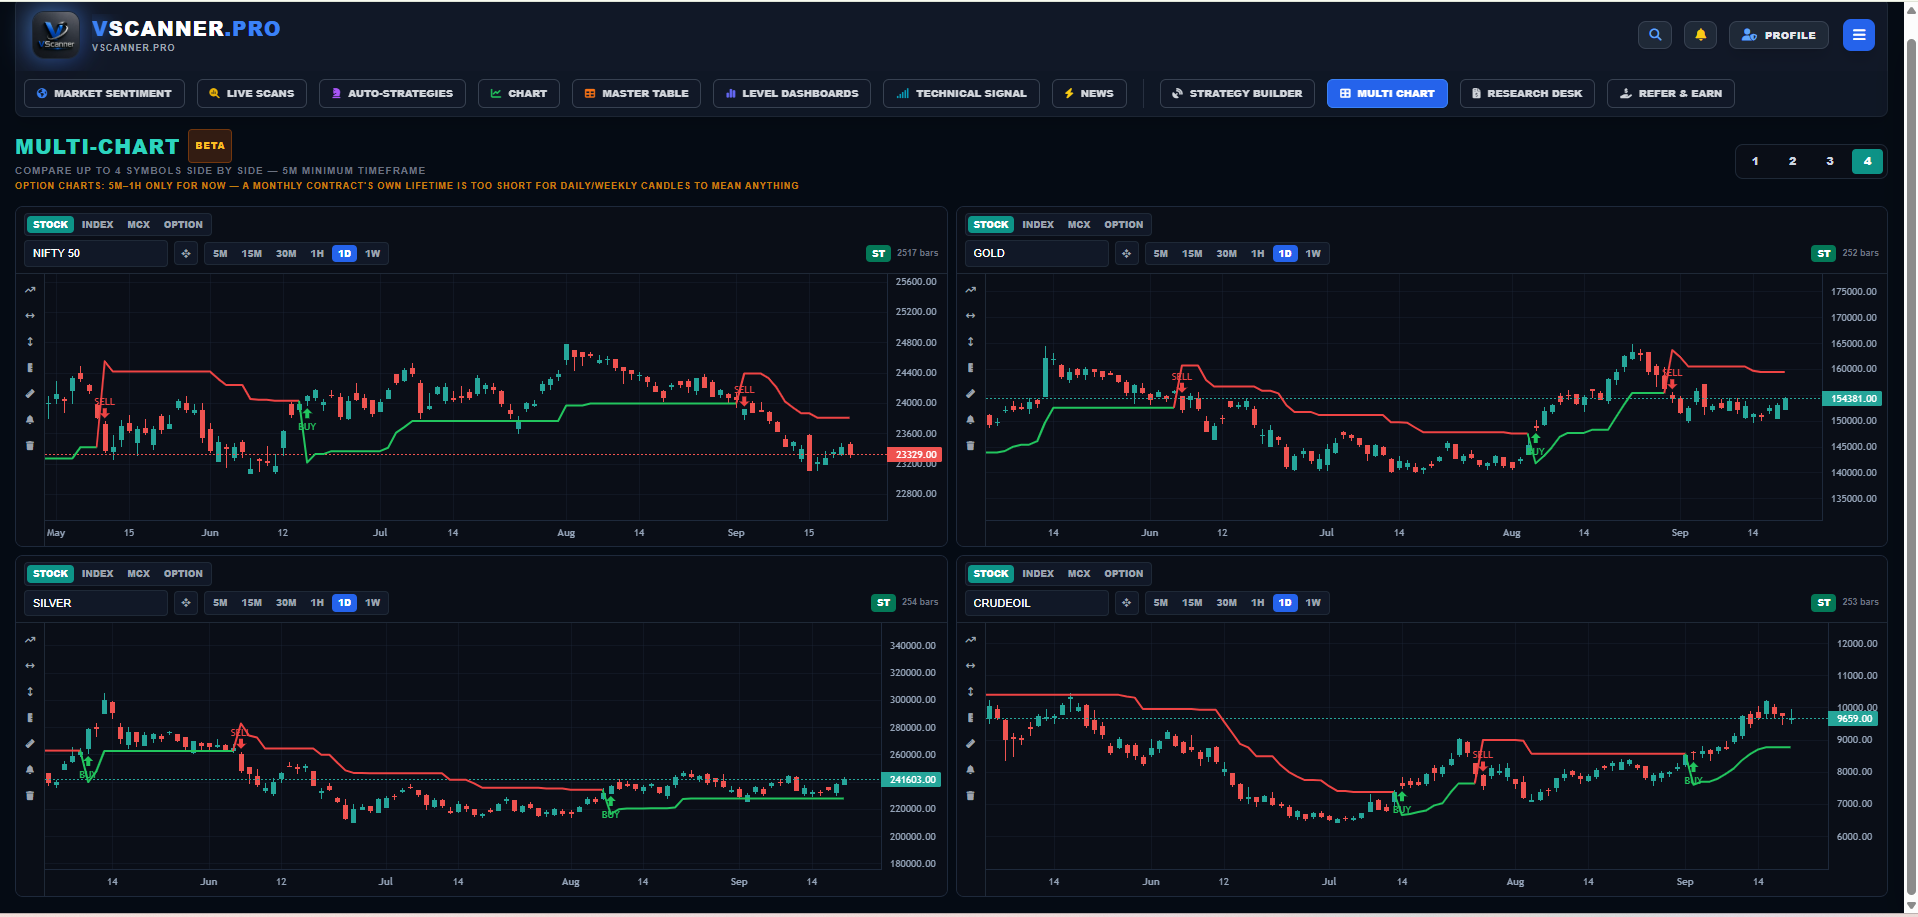
Multi-Chart: four-chart side-by-side workspace tracking NSE Equities and MCX Commodities concurrently.
Option Chain
For index derivative traders, open interest positioning provides critical context for intraday support and resistance. The live Option Chain modal presents strike ladders with real-time Call and Put open interest, open interest change, Put-Call Ratio (PCR), and Max Pain across strikes.
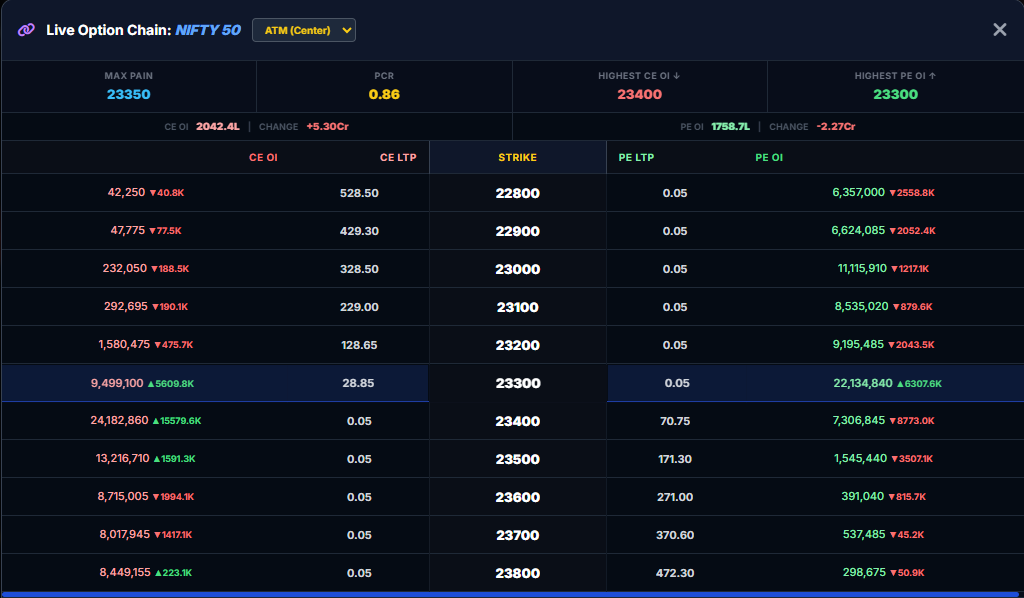
Live Option Chain: real-time strike ladder displaying Open Interest distribution, Put-Call Ratio, and Max Pain across strikes.
The technical layer behind the UI
The harder part was keeping data fresh across hundreds of symbols without making every page request recalculate the same work.
Four key engineering areas shaped the system:
1. Different exchange sessions:
NSE Cash closes at 15:30 IST, Equity Derivatives close at 15:40 IST, and MCX commodity sessions can continue until 23:30/23:55 depending on the contract and season. The platform uses exchange calendar logic to respect individual market hours and official holiday closures across segments.
2. Data freshness:
To ensure traders see current numbers without stale prices, incoming market feeds are continually processed and verified against exchange timestamps.
3. Redis caching:
Evaluating technical indicators across multiple timeframes for hundreds of symbols on every page request would quickly exhaust server resources. A central Redis cache stores precalculated indicator snapshots, allowing the web layer to serve user queries quickly from memory.
4. Background compute:
Heavy indicator calculations run in separate background worker processes, keeping compute load decoupled from the application server and ensuring the dashboard remains responsive during peak market activity.
How the data moves
A high-level view of how market data flows from external sources through the caching layer and into the user terminal.
Market Data
Live quotes, OHLCV bars, and option chains from market-data APIs
Ingestion & Compute
Session-aware feed polling and batch technical indicator calculation
Redis Cache
In-memory store for precalculated indicators and live tick snapshots
Flask / API
Serves precomputed data and watchlist state
Terminal UI
Canvas charting, 80-column Master Table, and Option Chain
Exchange & Session Rules
Market hours · holidays · NSE / MCX calendar enforcement
Background Worker Compute
Runs batch indicator calculations separately from web requests
My role and workflow
I worked as the Software Developer & Product Builder, taking client requirements through to a deployed product.
I worked directly with the client to translate their trading rules and community feedback into expected product behavior. I tested the running application during live market use to identify what was working, what was incorrect, and what was missing.
Implementation ran on an AI-assisted workflow with Claude and Codex handling a substantial part of the code generation, technical analysis, and debugging. I directed each iteration, decided what product behavior was required, verified the resulting implementation from the user side, decided what was ready to ship, and handled deployment and ongoing iteration.
Technical snapshot
- Role
- Software Developer & Product Builder
- Stack
- Python, Flask, SQLAlchemy, Redis, TradingView Lightweight Charts, jQuery DataTables, Tailwind CSS
- Markets
- National Stock Exchange of India (NSE Cash & F&O), Multi Commodity Exchange (MCX)
- Hosting
- Linux Cloud VPS, Nginx, Gunicorn, systemd, Redis, background compute workers
- Status
- Live and used by the client and a small group of users.
Technical Architecture Note
For an in-depth breakdown of self-hosted canvas charting, calculating indicator distance percentages across 2,000+ NSE symbols, and viewport consolidation, read the companion build note: Designing a High-Density Market Scanner & Trading Terminal →
Need something like this?
Tell me what you need, your timeline, and what is already in place. Smaller scoped work is welcome too.